Executive Summary
The IoT Developer Survey 2018 collected feedback from 502 individuals between January and March 2018.
The key findings in this year’s edition of the survey include the following:
- Amazon AWS and Microsoft Azure are the top 2 cloud services for IoT. Google Cloud Platform is failing to get traction.
- MQTT remains the standard of choice for IoT messaging, while AMQP is becoming more and more popular as companies scale their IoT deployments and backend systems.
- 93% of the databases and data stores used for IoT are open source software. Data collected and used in IoT applications is incredibly diverse, from time series sensor data to device information to logs.
Introduction
For the past four years, the IoT Developer Survey has been a great way to look at the IoT landscape, from understanding the key challenges for people building IoT solutions, to identifying relevant open source technology or standards.
Just like in previous years (see results from 2017, 2016 and 2015 survey), the Eclipse IoT Working Group has collaborated with a number of organizations to promote the survey to different IoT developer communities: Agile-IoT H2020 Project, IEEE, and the Open Mobile Alliance (now OMA SpecWorks).
We had a total of 502 individual responses. You will find a link to the complete report at the end of this blog post, as well as pointers to download the raw survey data.
Here are the key trends that we identified this year:
[toc exclude=Executive*|Intro*]
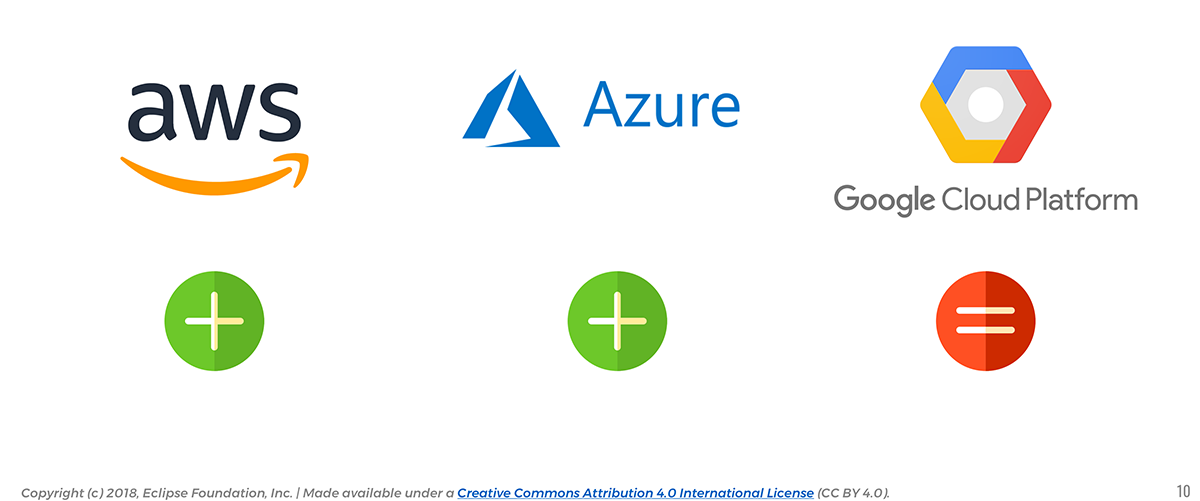
Amazon and Azure get traction, Google slips behind
For the past few years, we’ve asked people what cloud platform they use or plan on using for building their IoT solution.

Since 2016, Amazon AWS has always come up as the platform of choice for the respondents, followed by Microsoft Azure and Google Cloud Platform.
📎 The use of AWS for building IoT solutions increased by 21% since 2017. 
Looking at this year’s results, there is a clear upward trend in terms of adoption for Amazon AWS (51.8%, a 21% increase from last year) and Microsoft Azure (31.21%, a 17% increase from 2017). In the meantime, Google Cloud Platform is struggling to get adoption from IoT developers (18.8%, an 8% year-to-year decrease).
📎 Google Cloud Platform struggles, with an 8% decrease in market share for IoT deployments since 2017.
Seeing AWS ahead of the pack is no surprise. It seems to be the public cloud platform of choice for developers, according to the recent Stack Overflow Developer Survey, and one of the most loved platforms for development in general. And looking at the same survey, it seems Google is not really doing great with their Cloud Platform (it is used by 8.0% of the respondents vs. 24.1% for AWS).
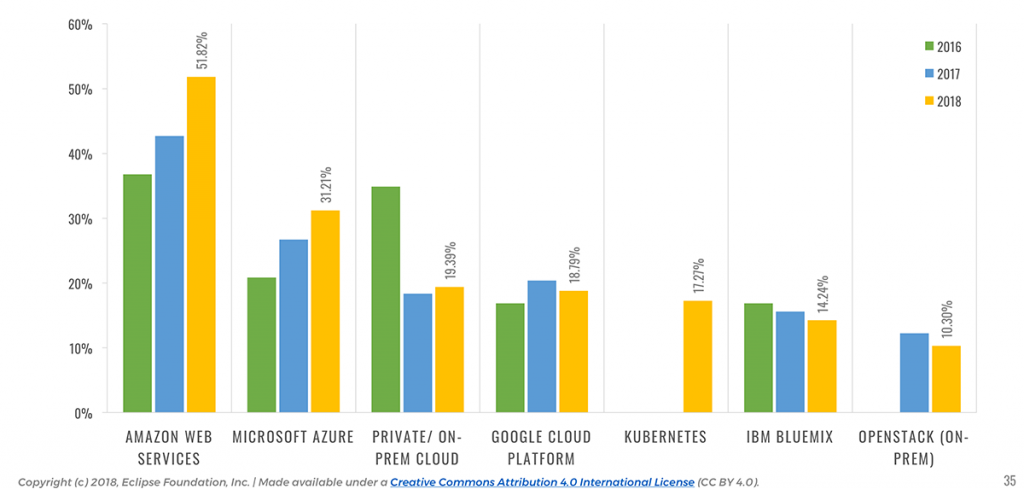
It will be interesting to see how, and if, Google catches up in the IoT cloud race, and whether we will see more acquisitions similar to Xively’s in February to help beef up their IoT offering in 2018. Since Microsoft is planning to invest $5 billion in IoT over the next four years, the IoT cloud competition will definitely be interesting to follow…
IoT Data is finally getting attention
While IoT has been around for a while now, it looks like developers are starting to realize that beyond the “cool” factor of building connected devices, the real motivation and business opportunity for IoT is in collecting data and making sense out of it.
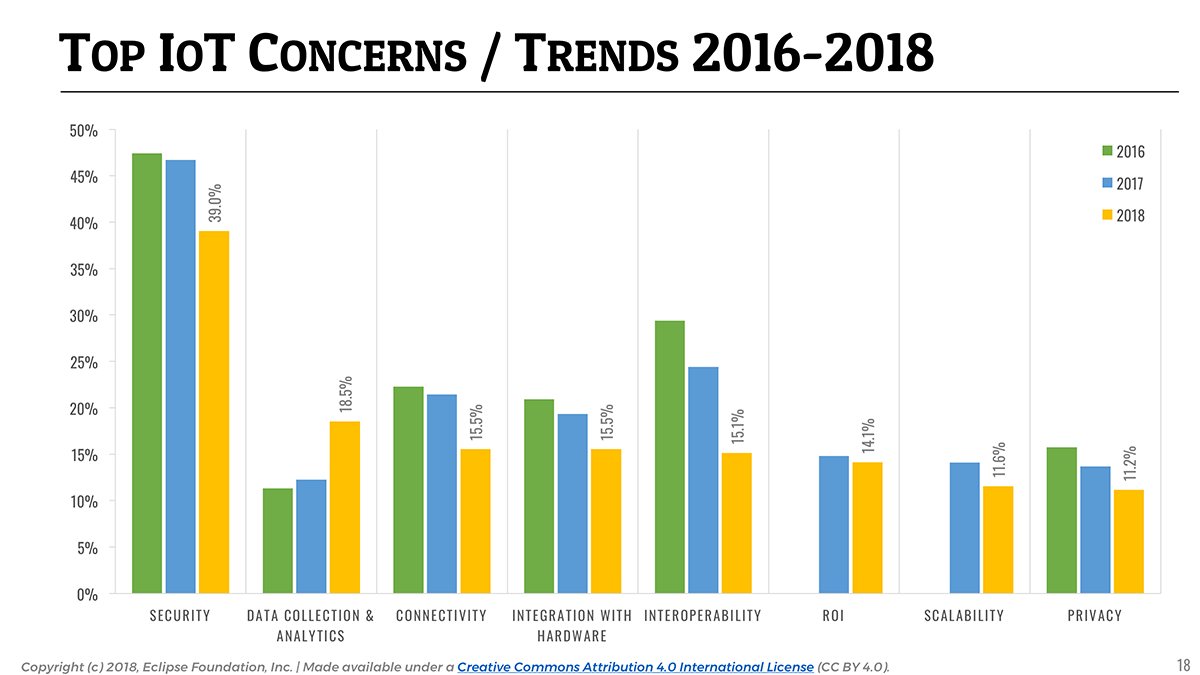
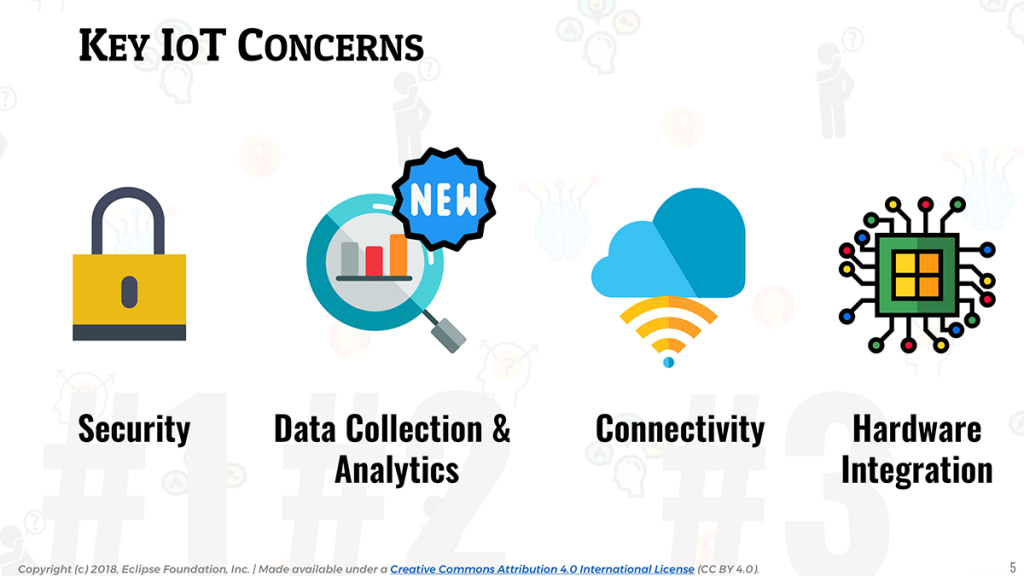
📎 Collecting and analyzing data becomes #2 concern for #IoT developers.
This year, 18% of the respondents identified Data Collection & Analytics as one of their top concerns for developing IoT solutions. This is a 50% increase from last year, and puts this topic as #2 concern—Security remains #1, and Connectivity is sharing the third place with Integration with Hardware.
Unsurprisingly, industries such as Industrial Automation or Smart Cities tend to care about IoT data collection and analytics even more—23% of the respondents working in those industries consider data collection & analytics to be a key concern.
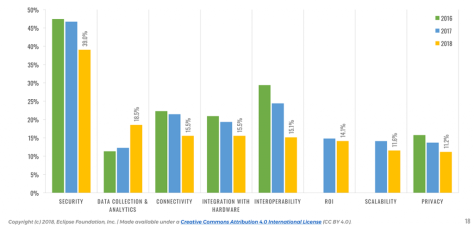
On a side note, it is great to get the confirmation of a trend we identified last year, with Interoperability clearing becoming less of a concern for IoT developers. It’s been ranking #2 since we started doing the survey in 2015, and is now relegated to the 5th place.
As someone working with IoT open source communities on a day-to-day basis, I can’t help but think about the crucial role open standards and open source IoT platforms have had in making IoT interoperability a reality.
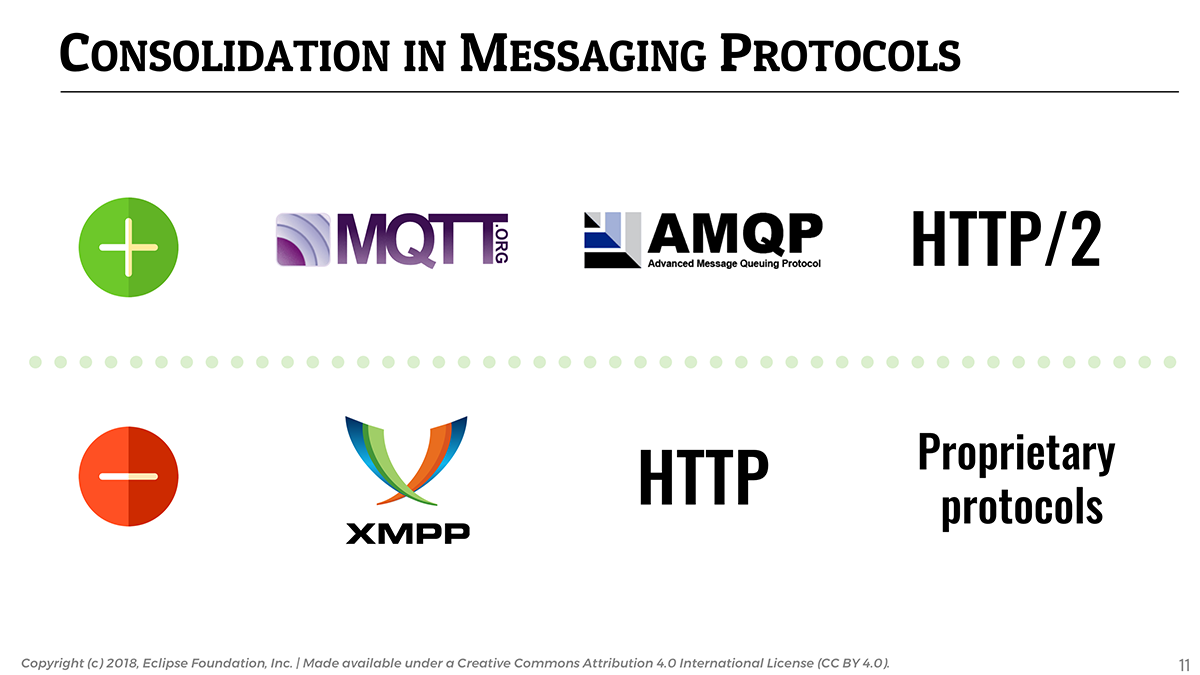
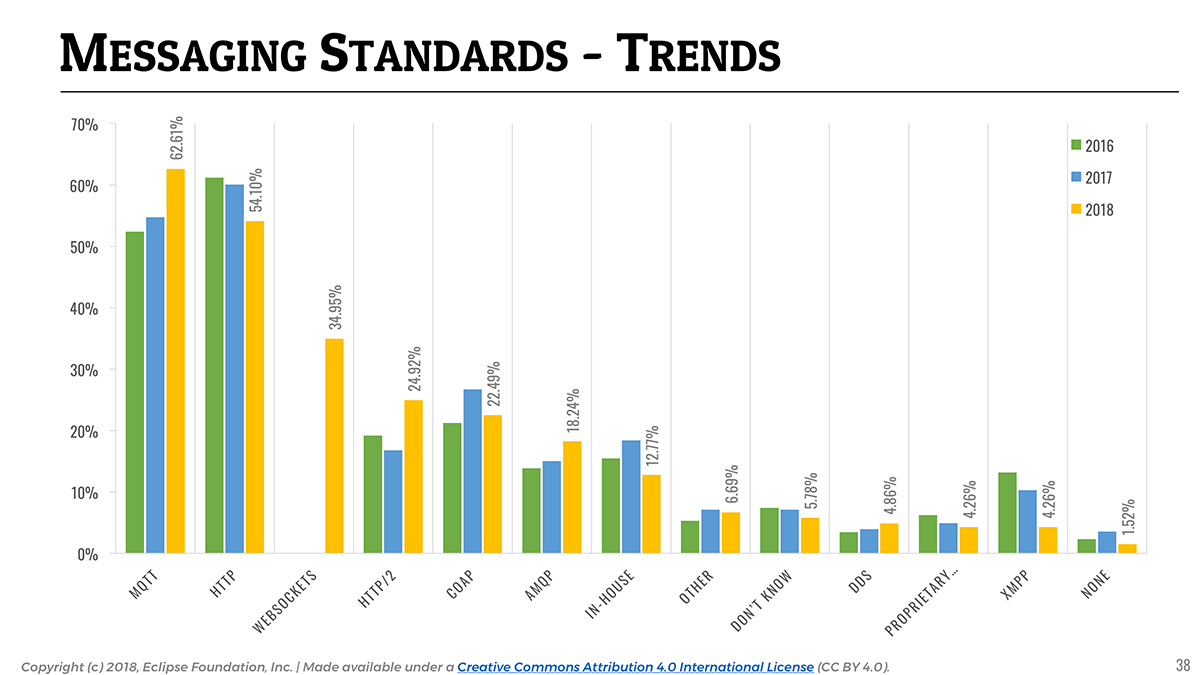
Consolidation in IoT messaging protocols
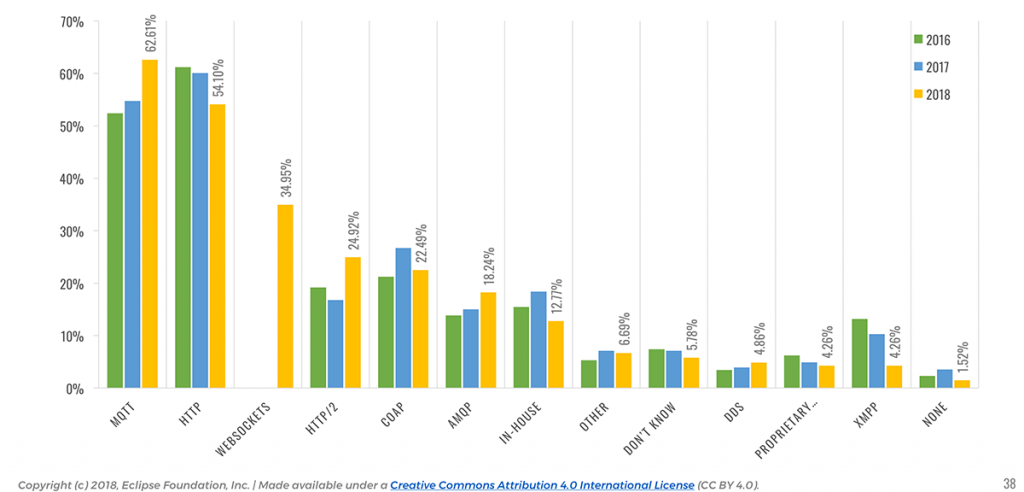
📎 MQTT is used in 62% of IoT solutions and remains the IoT messaging protocol of choice.
An area I particularly like to observe year-over-year is the evolution of IoT messaging protocols. For many years now, MQTT has established itself as a protocol of choice for IoT, and this year’s survey is just confirming this: MQTT is used by over 62% of our respondents, followed by HTTP (54.1%).
Six years after IBM and Eurotech open sourced their implementations of the MQTT protocol (see the Eclipse Paho project), and with the ever-increasing popularity of the Eclipse Mosquitto project (and many other open MQTT-based projects out there of course), this is once again a demonstration that open wins. With MQTT 5 around the corner and several of the identified “limitations” of the protocol gone, MQTT will possibly become even more clearly THE IoT messaging standard in the future.

It would appear that the use of HTTP is declining (54.1%), perhaps to the benefit of the more lightweight and versatile HTTP/2 (24.9% vs. 16.8% last year). XMPP (4.3%) is one of the protocols that seems to be losing the protocol consolidation battle, with a continued decline since 2016.
📎 Adoption of AMQP increased by over 30% since 2017 as people scale their IoT deployments.
Since more and more people start scaling their IoT deployments, it is likely a reason for the significant increase in AMQP’s adoption (18.2%, from 13.9% last year), which is a core element of many IoT backends.
The use of proprietary vendor protocols and in-house protocols is steadily decreasing, confirming that the industry at large tends to favor open standards over closed solutions.
It will be interesting to watch how the adoption of DDS (4.9%) evolves over time. It already seems to be getting some traction in domains such as Automotive, where 10% of the respondents said they are using it.
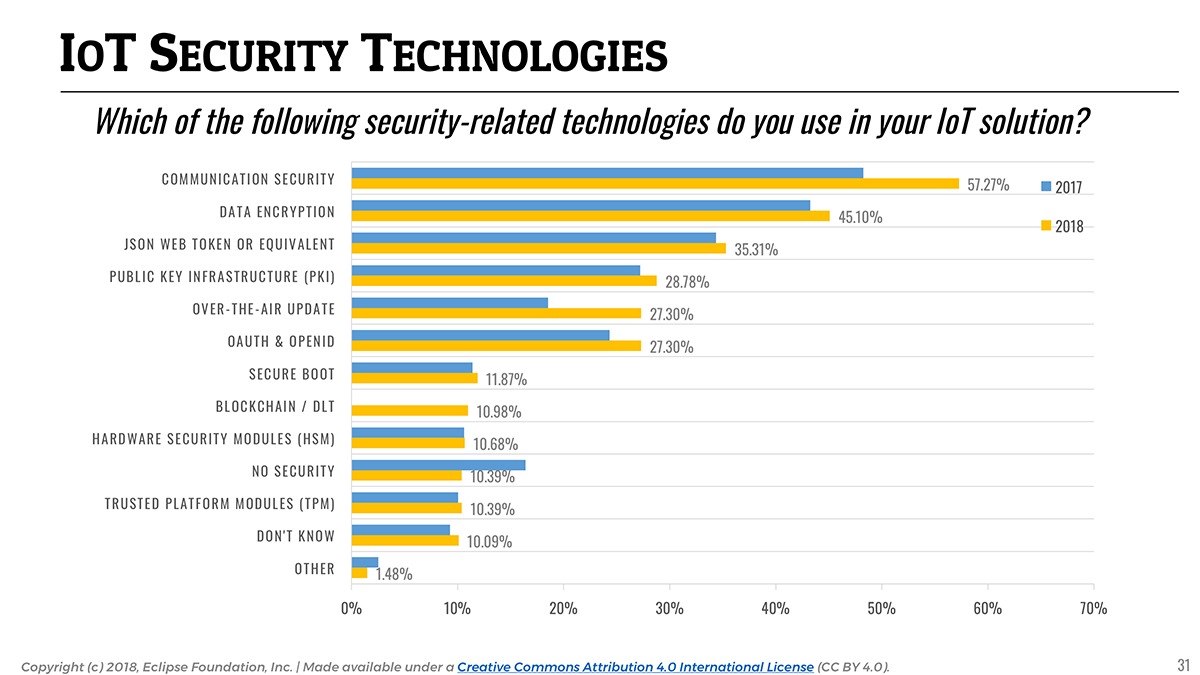
Focus on security increases
It is always interesting to watch how developers approach security in the context of IoT, and it has always been mentioned as the #1 concern for IoT developers since we started doing the survey in 2015.
However, it is no secret that security is hard, and there is unfortunately still only a limited set of security-related practices that are on the front burner of IoT developers. Communication-layer security (e.g the use of TLS or DTLS) and data encryption remain the two most popular practices, used by respectively 57.3% and 45.1% of the respondents.
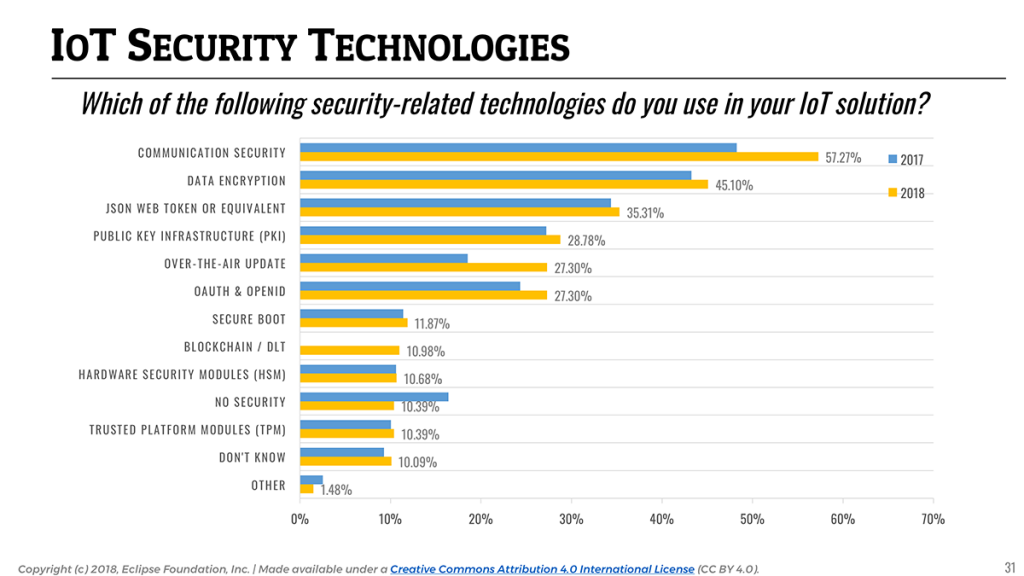
For the first time in the history of this survey, we explicitly asked respondents if they were using blockchain or distributed ledger technology (DLT) in their IoT solutions. I was frankly surprised to see that it would appear to be the case for 11% of the respondents. As the technology matures, and as some of the barriers making it sometimes impractical for constrained/embedded devices slowly disappear, I am expecting blockchain & DLT to be used more and more for securing IoT solutions (and probably in combination with data monetization use cases).
📎 Adoption of over-the-air updates to keep IoT applications up-to-date and secure increased by almost 50% since last year.
To end on a positive note, it is pretty clear that developers are starting to bake security into their IoT products, as an increasing number of developers indicated they implement security techniques compared to 2017. Over-the-air updates appear to be used more and more (27.3%, a 47% increase from 2017). Open device management standards such as LWM2M, together with open source implementations such as Eclipse Wakaama and Eclipse Leshan, are certainly making it easier for developers to implement OTA in their solutions.
IoT Data is multifaceted and open source databases dominate the market
This year we added a few questions to the survey aimed at understanding better the kind of IoT data being collected, and how it is being stored.
It is interesting to see that across all industries, IoT data is equally multifaceted, and a wide variety of data is being collected by today’s IoT applications. 61.9% of the data collected is time series data (e.g sensor data), but almost equally important are device information (60.4%) and log data (54.1%). This is not really surprising as collecting sensor data is only half of the IoT operational equation: one also needs to be able to track and manage their fleet of devices.
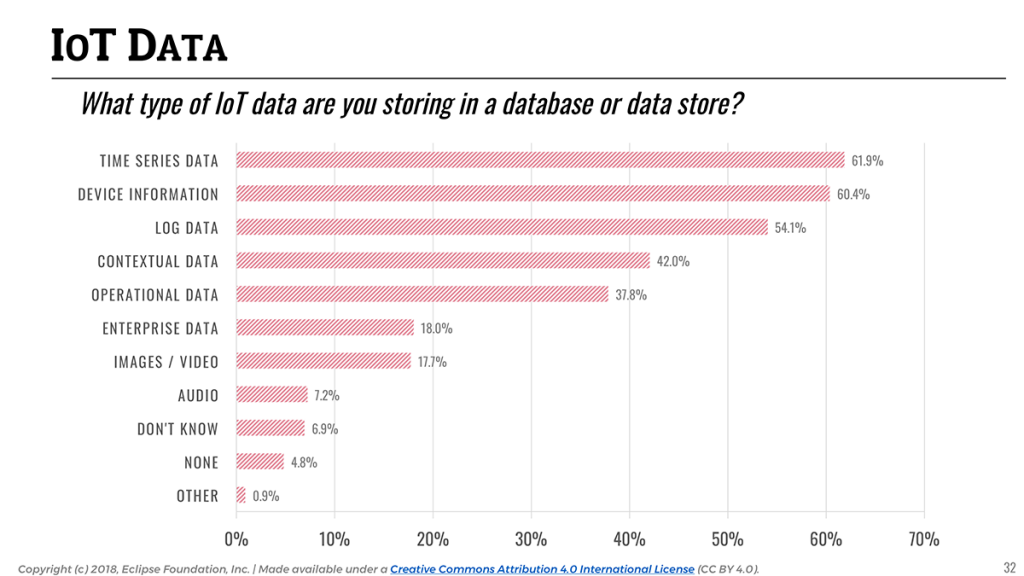
Keeping that in mind, it is interesting to look at the landscape of databases and data stores used for IoT applications. While time series data is the most common form of data that IoT applications collect, traditional relational databases (namely, MySQL, with a clear leading position at 44.6%) are still widely used. It is likely reflecting the importance of storing all kinds of device metadata or legacy enterprise data in addition to sensor data.
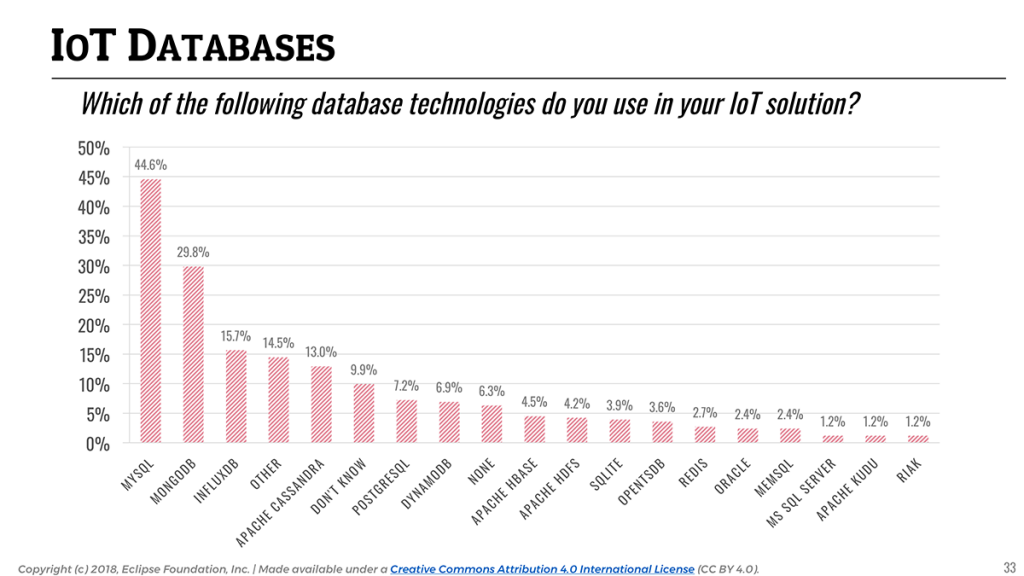
With regards to NoSQL and time series databases, MongoDB (29.8%) and InfluxDB (15.7%) seem to be the two platforms of choice for storing non-relational IoT data (e.g time series).
📎 93% of databases used in IoT are open source.
It is worth highlighting that an astounding majority (93%) of the databases used for IoT are open source, with Amazon DynamoDB (6.9%) being the only notable exception. With something as critical and sensitive as IoT data, it seems that solution developers tend to favor technology that is not only easy and free to access, but more importantly that allows them to really “own” their data.
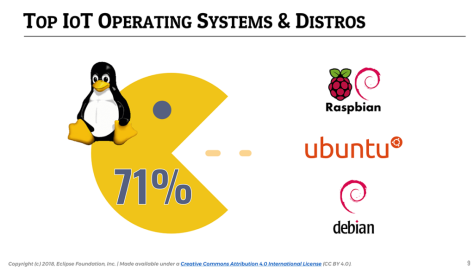
Linux remains the undisputed IoT operating system
Once again, Linux (71.8%) remains the leading operating system across IoT devices, gateways, and cloud backends.
Although Amazon’s acquisition of FreeRTOS occurred just a few months before the survey opened, it might partially explain the significant increase in its reported adoption. Going from 13% in 2016 to 20% this year, it becomes the leading embedded IoT operating system, followed by Arm Mbed (9%) and Contiki (7%).
📎 FreeRTOS becomes the leading embedded #IoT operating system, followed by Arm Mbed and Contiki OS.
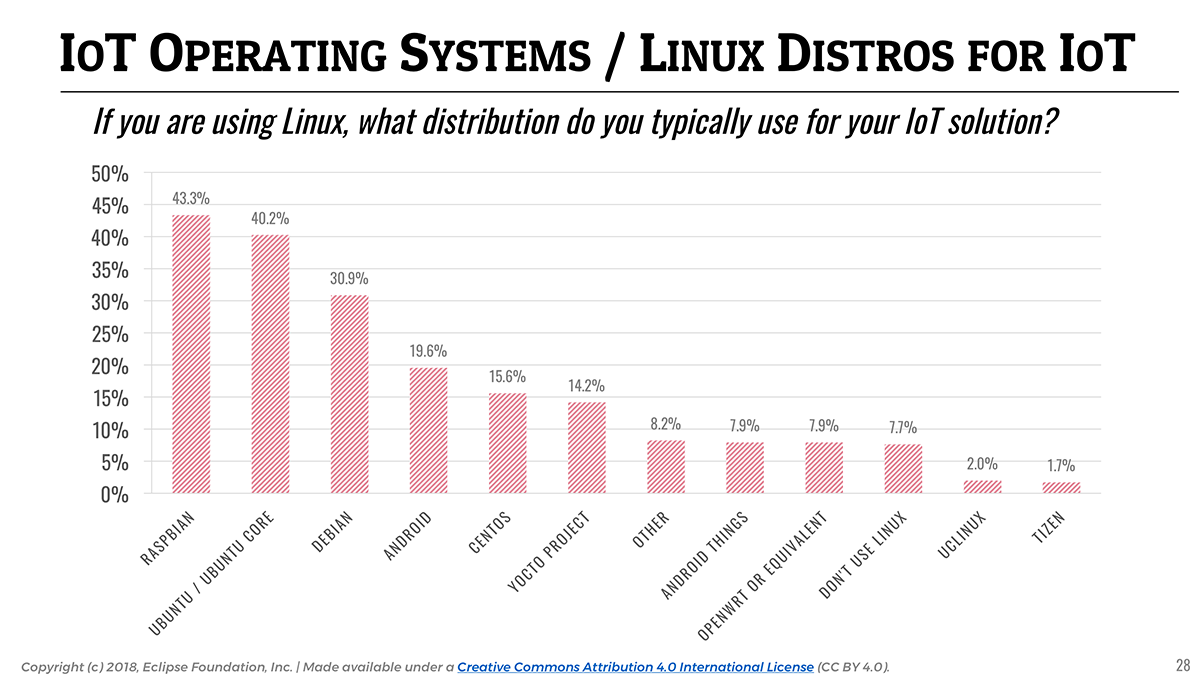
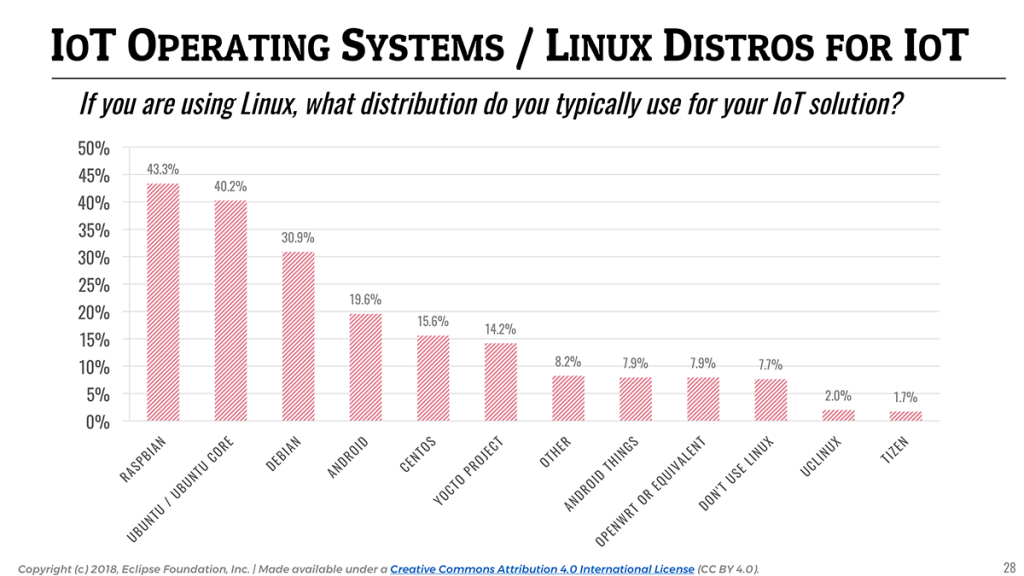
In terms of Linux distributions, and as Raspberry Pi stays a very popular platform for IoT prototyping, Raspbian (43.3%) remains the top Linux distribution followed by Ubuntu (40.2%).
You can find the complete report on Slideshare.
Should you want to play with the raw data yourself, we made it available as a Google Spreadsheet here – feel free to export it as whatever format suits you best.
Mike Milinkovich and I will be doing a webinar on Thursday, April 19, to go through the results and discuss our findings. Don’t forget to RSVP!
Thanks to everyone who took the time to fill out this survey, and thanks again to IEEE, OMA SpecWorks and the Agile-IoT project for their help with the promotion.
I am very interested in hearing your thoughts and feedback about this year’s findings in the comments of this post. And, of course, we are always open to suggestions on how to improve the survey in the future!
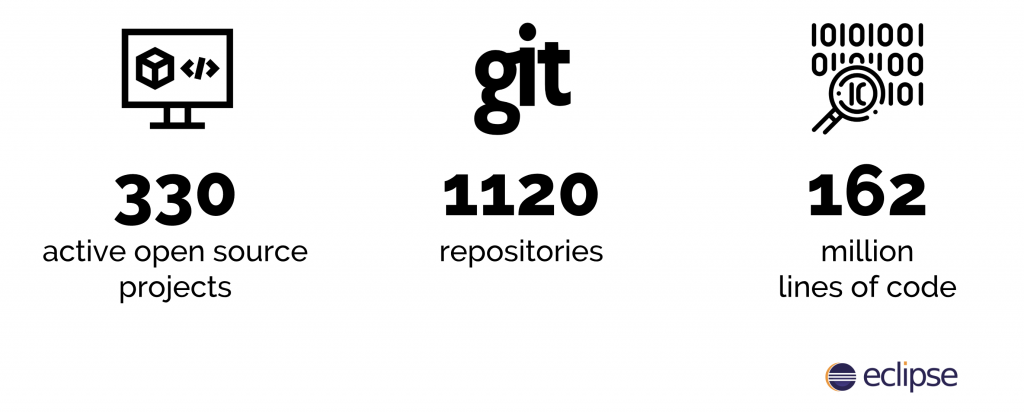 That’s right, as of August 1st, there are 330 active open-source projects hosted at the Eclipse Foundation and if you look across the 1120 Git repositories that this represents, you will find over 162 million physical source lines of code. But beyond this number, let’s look at how it was obtained, and what it really means.